Mobile figures for arts organisations and the Audiences NI Digital Review
I’m always keen to latch on to some decent new research/stats/whatever. Here’s a couple of new things from last week.
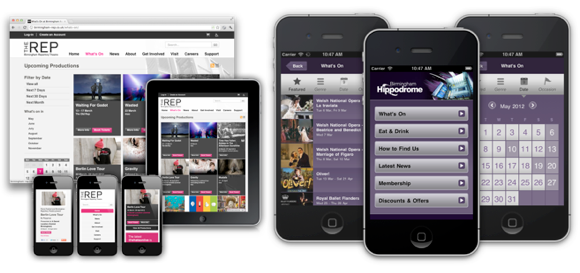
Mobile website traffic and arts organisations: some figures

This is a post from over on the Made Media website. I helped write it, but it was Mark James who did the research and pulled out the findings.
The stats in that post are actually just a small sample from a bit of research we did for a client who’s looking to commission a mobile site. With our client list consisting of quite a few large arts organisations and venues we had a decent sample to draw from. A few choice bits:
- Websites that account for mobile visitors get more mobile visitors
- When people buy tickets on mobile devices they buy the same number and value of tickets, they just do so between 20%-50% less often
- Mobile traffic splits 50:50 between mobile phones (of any sort) and iPads
In terms of average revenue per visit:
- Desktop/laptop users spend the most money
- A tablet user is worth roughly 80% of a desktop user
- A mobile phone user is worth roughly 50% of a desktop user
For more stats and a bonus graph, read the full post here.
Audiences NI: Digital Review for 2012

Audiences NI’s Digital Review 2012:
aims to give an overview of how the population of Northern Ireland currently use the internet, how arts organisations are currently using digital media and how you can be using and evaluating your digital media more effectively to ensure it’s a good use of your resources.
It looks like a decent piece of research too. A few bits that interested me:
- The ‘measuring web traffic’ table on p6 is very revealing. Too few organisations are monitoring sales/ROI and data capture. This is a BIG problem.
- 70% of the arts organisations surveyed said they use either Google Analytics (43%) or their website/hosting’s built-in analytics (27%). Again, too low.
- 11% of arts organisations surveyed currently have a mobile version of their website. 35% are thinking about getting one.
Probably the strongest part of the report is the section on email marketing (pp16-18). Taking figures from their own email marketing system which, in 2011, saw 23 arts organisations send 224 campaigns to 335,668 recipients, they found:
a benchmark open rate of 27% of emails opened per campaign, and a benchmark click-through rate of 3%.
Useful. There’s also some information about the types of content sent out and the size of their mailing lists. On the latter, I’d love to see how mailing list size correlates to the size of an organisation (by turnover, staff size or value – take your pick). That way you’d be able to see who’s ahead or lagging behind.